Seismic Services
Geological Services
Reservoir Characterization
Solutions
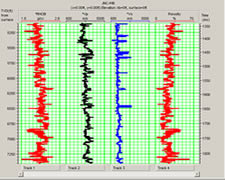
Bulwark Services Limited has the technical expertise and innovative tools required in the digitization of all kinds of wireline formation evaluation logs (such as GR, resistivity, sonic, density, neutron, spectral GR, and SP logs e.t.c.), dip meter logs (such HDT and tadpoles) and interpreted lithology logs.
We have executed a number of map digitization projects for the Nigerian E & P majors. The work involved digitization of contours, faults, horizons, well locations and shot points on structural geological maps, digitization of different layers of facies from seismic facies maps, digitization of X-Y or navigation data from base maps and digitization of topographic, base and coverage maps.
Robust workflow
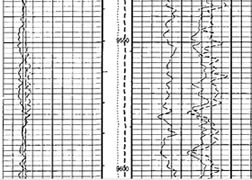
Well logs and Maps are scanned to give high-resolution colour, greyscale or black & white TIFF images. Apart from being the starting point for the vectorizing process, these images can be stored and shared across a network like a digital atlas.
Conversion of features on a map to digital format is done on-screen, at a range of zoom levels, with the mouse positioned on the scanned image. On-screen digitizing allows maximum accuracy in terms of point for point data extraction. An immediate visual overlay of the digitized data gives the operator a simple but highly efficient QC of output data quality. Flexible projection and spheroid definition along with three different gridding methods allow the user to define an accurate baseline for data capture. Auto digitizing, as well as manual options, give a fast and reliable means through which all types of map data may be captured.
Contours, simple faults, fault polygons and seismic facies can be captured and output in standard formats, as well as shot point, cultural data, block boundary and well head data. Co-ordinate systems may be modified on output from the digitizing software and digitized data may be redisplayed as colour plots at a range of scales. Where desired, output formats may be tailored to specific client standards. Once digitized, data from different sources can be integrated to create a rationalized geodetic information bundle.
Interpretation
Interpreted seismic faults and horizons can be captured in much the same way as the maps are digitized. Colour, greyscale or black and white scans of the interpreted seismic data are digitized on-screen. A grid representing temporal and spatial changes on the seismic section is created and verified prior to data capture. An option of auto tracking a colour keyed horizon is available and multiple faults and horizons can be captured on each line. The output data are related to line name, horizon name, etc. and can be merged with navigation data where available.
Features include:
- Automatic curve tracking algorithm, with a manual digitising option when required
- Accepts digital data in LIS, LAS, BIT or PTF format
- Ability to overlay digital data against scanned images to show the correlation between digital data and paper log, and to highlight discrepancies and missing data
- Resampling and units conversion capability
- Outputs digitised data to disk in LIS or LAS format